
- Don’t measure how much work you did, measure the impact you made on the business.
- Select the right tasks by creating a simple chart of value vs effort.
Mistaking Effort for Progress
In Feb 2017 I joined woo.io as manager of R&D. Up to that point I’d only worked in medium to large corporate environments. It was my first time at a startup and I didn’t know it then, but I was in for a shocking ride.
When I joined, I thought that I could fix all the problems that R&D was experiencing by implementing my familiar ‘corporate’ development processes. I quickly discovered that even if I implemented these processes effectively, we still wouldn’t achieve the outcome we were looking for.
Here’s Why:
At my first meeting with the CEO, he laid down his main vision for R&D. He said “the entire company is data driven, the only place where it is not is R&D”. And he was right. For me, seeing a small startup that measures every new feature against it’s KPIs was impressive but R&D itself, while making the keyboards smoke, was working in a semi-managed chaos of sorts.
The solution at the time seemed to be straightforward, so we started to apply some standard scrum processes.
- Using story points to estimate the effort for tasks
- Measure our velocity over sprints
- Set up a goal to finish 80% of the content for each content sprint. (seems like the right balance between providing predictability while constantly aiming higher)
- Tagged about 50% of the selected tasks as hard committed (which means that the team is committed to finish them within the sprint).
Once the new processes were implemented, we took a few weeks to test them out, and the results were perfect, about 95% of the hard committed tasks were finished along with an overall 80% completion rate. We finished the tasks that we selected, we gave good enough predictability to the task release timeline and the graphs looked great. 🙂
But, then. Reality set in. When I sat down again with our CEO a couple of months later, I heard frustration in his voice, “What has changed? How is R&D making an impact on the business?” he asked.
We chose the high priority tasks, worked at a rapid pace, so how come the answers to these questions were not so easy? Are we choosing the right tasks? Which business KPIs did we need to improve? It might be that everything was perfect but there were simply no data points to investigate.
We understood that our process had a huge blind spot, as we didn’t invest enough time to understand how each task will help the business and what impact it would have.
Looking at the Right Data
We started to tag all of our tasks with:
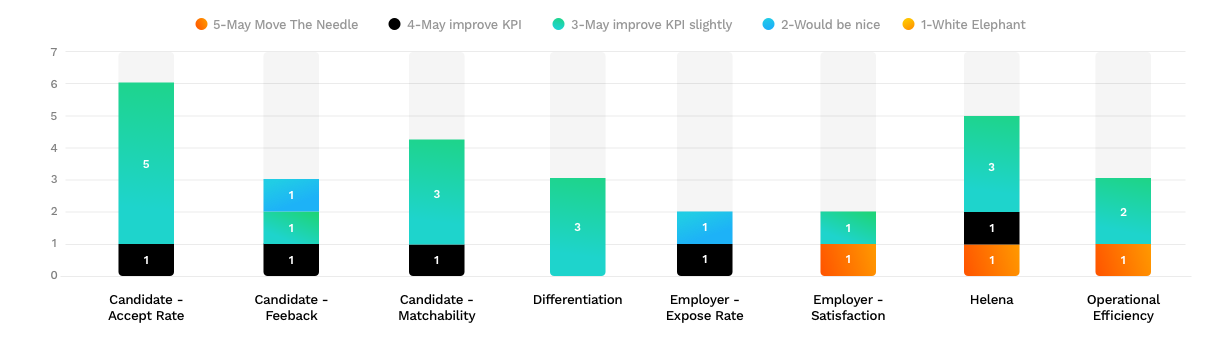
- Business Value – list of company KPIs that this task will improve
- Value Points – from 1 to 5 (1 – “no value” —> 5 – “may move the needle”)
Then we started to get visibility into the bigger picture and the current resource allocation. This helped us figure out where to best invest our resources.
Reports like “resource investment per business value” and “business values’ anticipated impact” became easy to generate.
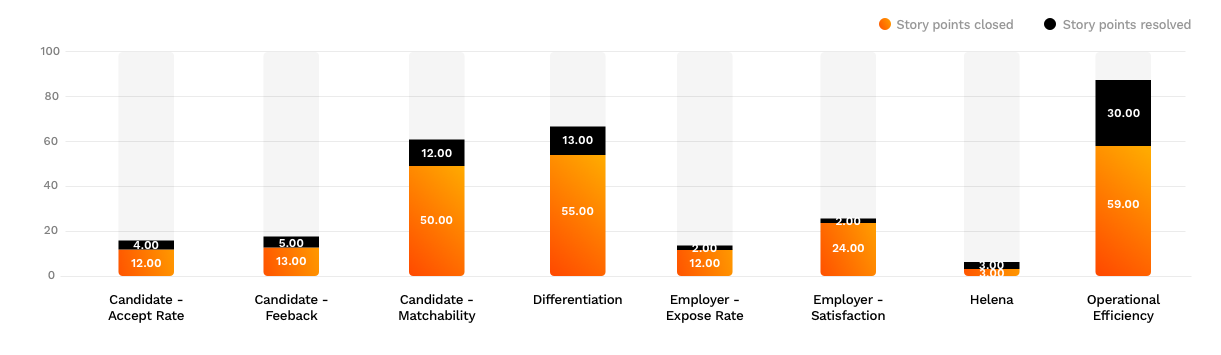
So now we could answer our CEO’s question of what impact R&D made on the business in the last month, but that only helped us in retrospect.
Our goal became much clearer. We needed to work on the right KPIs and finish as many value points as we could.
Portfolio Business Management Matrix
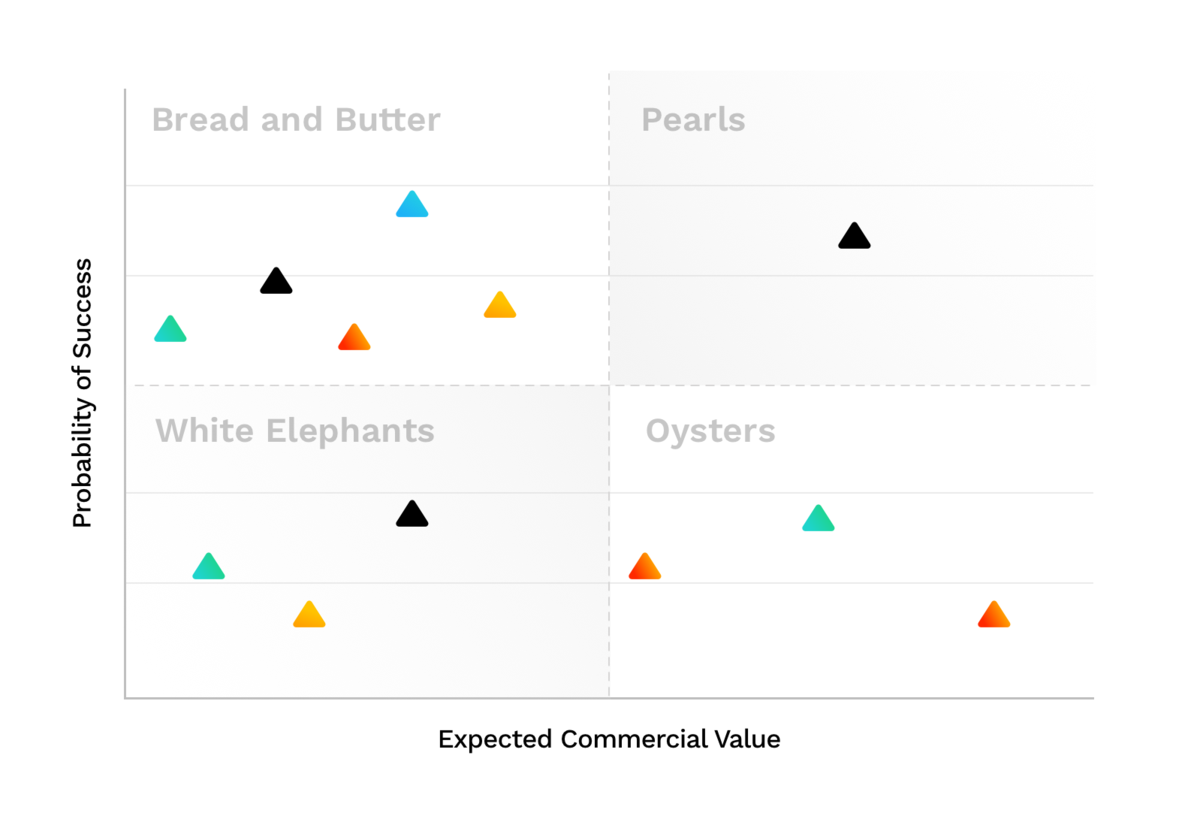
There is a known mechanism for a business to select the right opportunities to pursue. You draw a basic matrix with two axis. X starting from low to high potential business value and Y starting from low to high probability of success.
You then always take the few pearls that you have first and balance them between a small number of Oysters (sometimes called market differentiators) and your Bread & Butters (sometimes called quick wins). You do whatever you can to avoid the White elephant (could be legal/regulatory requirements).
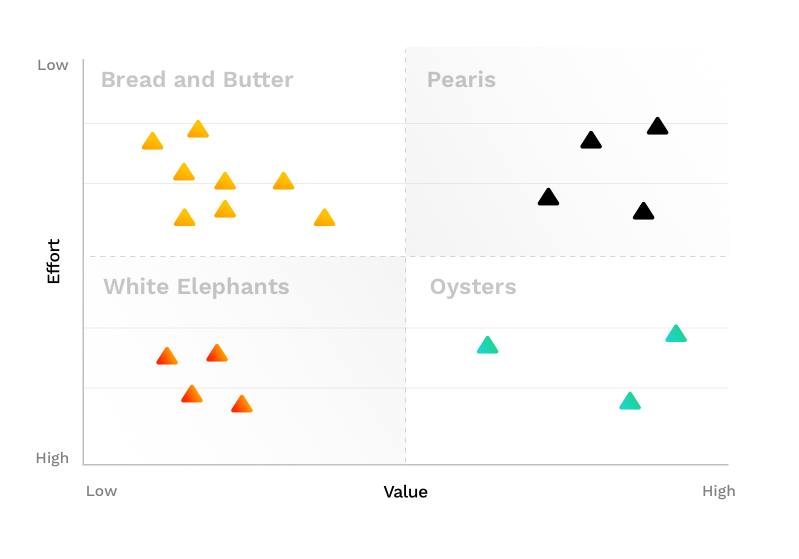
We took this concept and changed the Y axis to represent low to high effort, and now we could use the same opportunity selection mechanism to select the right tasks.
Becoming Data Driven
We shifted our process again and now:
- Every new task that is reviewed gets
- Story points estimation
- Value points estimation
- List of business values it will impact
- Once all tasks are filled, each task becomes visible in a new dashboard that ranks all the tasks and places each one in one of the following lists:
- Pearls
- Bread & Butters
- Oysters
- White Elephants
- We start each sprint by planning the synchronization of the current business priorities (mapped to clear KPIs)
- We compare against the prioritization helper dashboard and start selecting tasks accordingly
- At the end of the sprint planning we get a clear picture of how many value points are expected per KPI
- Our transparency policy allows all stakeholders to start a discussion on tasks, value points or our overall sprint effort distribution
Derivative Values from the New Process
Nowadays conversations that center around tasks focus on the business value. What’s the expected impact? Why do we anticipate such a major change? It is not only the trade off between tasks that is affected, but tasks need to also be refined to address the core potential value (usually shorter LOEs).
Our retrospective now includes an investigation of the KPI’s improvements vs the value points accomplished by R&D. So, when one of our KPIs doesn’t looks good we know whether it got the right focus, and if so we learn which value point assumptions were wrong.
Another value that came out of this new process is the stronger connection the dev team made to the business. That alone has a tremendous value as the developers now understand the purpose of each task better, can innovate around tasks, as well as understand when and where they can cut corners or suggest alternatives. But, in the end, they are more connected to other aspects of the business.